

Real-time project insights
Up to 50% time saving in reporting
Improved collaboration

Easy project dashboard setup for faster reporting
Cleopatra enables users to effortlessly create project dashboards, offering a wide range of visualization options to suit various reporting needs. This includes bar charts, pie charts, donut charts, bubble charts, S-curves, pivot tables and waterfall charts.
Meet stakeholder requirements with different dashboard views
We recognize that stakeholders may have varied information requirements, ranging from detailed insights to high-level overviews. To accommodate these diverse needs, Cleopatra offers the flexibility to create multiple dashboards and reports tailored to different user requirements. For instance, executives can access high-level KPI summaries, while project managers can view detailed WBS breakdowns or planned vs. actual spending graphs.


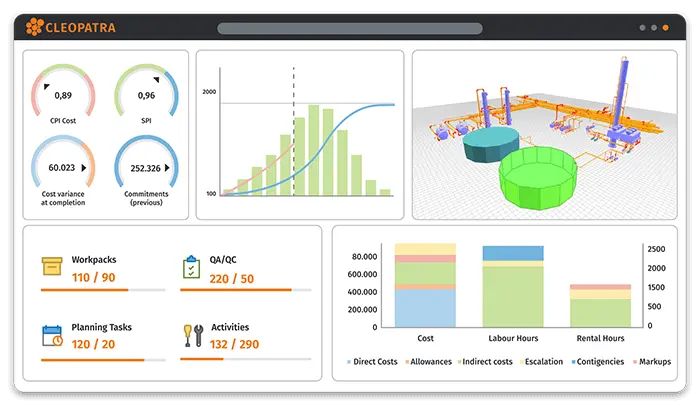
Real-time KPIs for confident project control
Cleopatra’s project controls software makes it easy to track the KPIs that project managers rely on most, including cost and schedule performance (CPI, SPI), planned versus actual spending, and resource utilization. Furthermore, by bringing these indicators together in clear, real-time dashboards, Cleopatra helps project teams reduce surprises, identify issues early on, and make informed decisions that keep projects under control and aligned with objectives.
Project dashboards with real-time data for improved decision-making
Real-time data integration with other relevant project and turnaround management systems, such as ERP and scheduling tools, keeps Cleopatra’s dashboards continuously up to date. This ensures transparency across all stakeholders and enables more informed decision-making. Furthermore, by giving project teams and contractors shared access to project dashboards, coordination and teamwork are further strengthened.


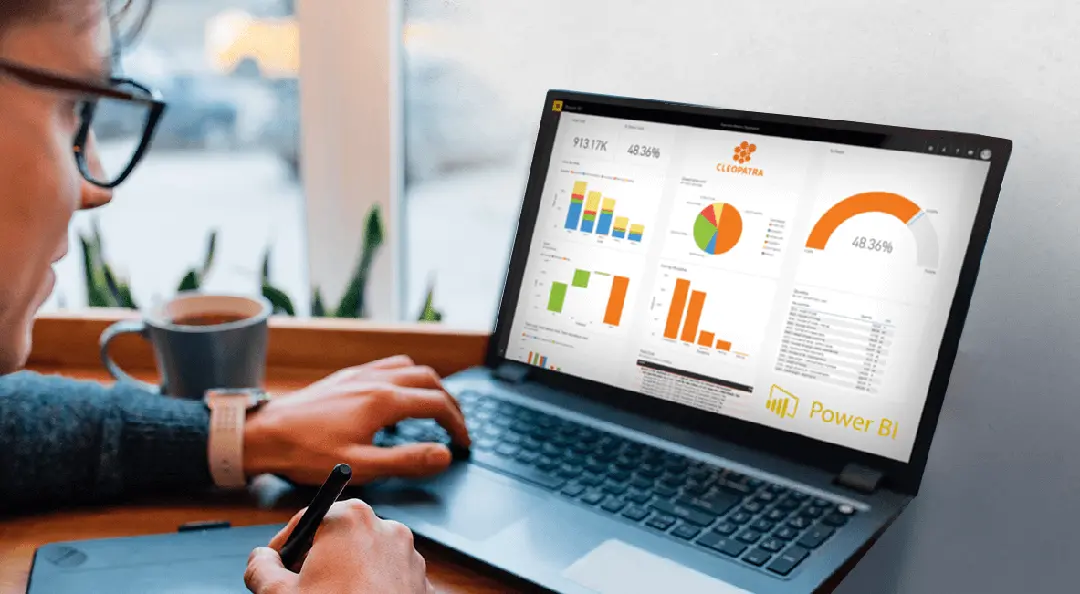
BI integration for external project reporting
Many organizations use Business Intelligence (BI) solutions to standardize project reporting. In addition to standard formats like PDF and Excel, Cleopatra offers seamless integration with BI tools such as Power BI. This ensures project data can be easily shared, aligned with corporate reporting standards, and analyzed alongside other business data for more consistent and informed decision-making.
Feature highlights
All our solutions come with their own unique features. This one does too! Explore a brief summary of some of them.
Improve communication through visualization
Intuitive and easy to understand by all stakeholders
Configurable design and KPIs
Real-time performance tracking
Full project overview by combining internal and external data
Support corporate decision-making by exporting to BI tools
What our customers are saying

Enhance project communication and decision-making
Empower stakeholders to visualize, analyze, and share key project data with customizable dashboards, ensuring informed decisions and allowing proactive management.
Resources to improve visual project reporting
 Webinar
Power BI in project controls: The top ways to optimize and visualize data
In this webinar, we introduce Power BI digital tool to help you bring your cost estimation and project controls to their highest potential.

Managing project costs with metrics and benchmarking
Project metrics allows you to benchmark a single project or a portfolio of projects, as well as further…

How to visualize your real-time costs with software
During project execution you want real time information about the status of your project. Here are some examples.
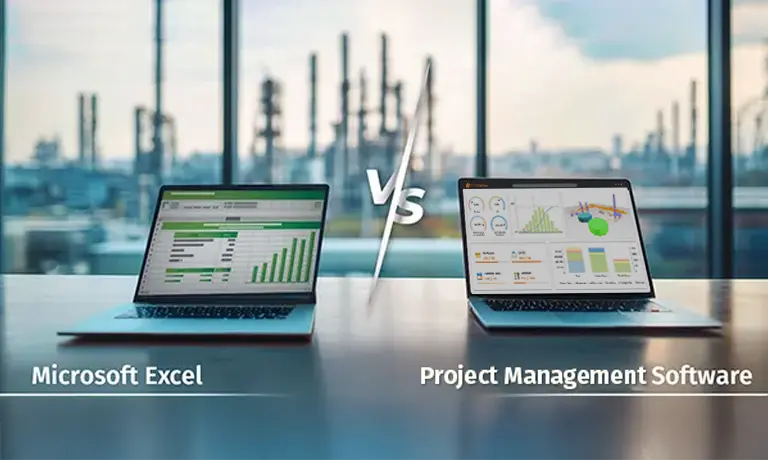
Project management software VS Excel
Project Management Software vs Excel: Which is best for your projects? Compare scalability, automation, and more to make…
Related solutions

Work Pack Management
The integrated turnaround management software supercharges your asset and material order management, captures necessary and detailed work package information, and smoothly runs field management. View solution
Work Pack Management

Data Analytics
Cleopatra Enterprise for benchmarking turns data into gold, identifies hidden trends and transforms your projects into success by making informed decisions. View solution
Data Analytics

BIM
Our Building Information Modelling (BIM) module optimizes digital information flow from your 3D model without losing precious time creating a Bill of Quantities (BoQ). View solution
BIM

Project Controls
Cleopatra Enterprise offers a dedicated cost control functionality, easy automation, and seamless integration with cost estimating software. View solution
Project Controls
Ready to start?
Request a live demonstration and experience the benefits Cleopatra Enterprise can have for your organization.