

The Cost Performance Index (CPI) and Schedule Performance Index (SPI) are two key Earned Value Management metrics used to measure whether a project is on budget and on schedule. CPI shows cost efficiency, while SPI shows schedule efficiency, helping project teams spot issues early and take corrective action before delays or overruns grow.
If you want a quick answer: CPI tells you how much value you earn for the money spent, and SPI tells you how much progress you make compared to the plan. Used together, they give project managers a clearer view of project health than cost reports or schedule updates alone.
Understanding CPI and SPI
Before looking at the formulas of both CPI and SPI, here is the practical difference. SPI shows whether work is moving at the planned pace. CPI shows whether that progress is achieved within budget. Looking at both helps teams see whether progress is on track and whether that progress is being achieved efficiently.
Simply put:
- SPI measures how efficiently the project is utilizing time.
- CPI measures how efficiently the project is utilizing budget.
Together, they show whether progress is being made fast enough and at the right cost. Or even more practical, a project can look acceptable on cost alone or on schedule alone. Looking at both avoids that blind spot.
What is the Schedule Performance Index (SPI)?
The Schedule Performance Index (SPI) measures how efficiently the project team is progressing compared to the planned schedule. It indicates whether the project is ahead or behind in terms of planned work.
Here is the formula to calculate SPI:
SPI = EV / PV
Where:
- EV (Earned Value) = The value of work actually performed.
- PV (Planned Value) = The value of work planned to be performed.
Interpretation:
- SPI = 1.0. The project is exactly on schedule.
- SPI > 1.0. The project is ahead of schedule.
- SPI < 1.0. The project is behind schedule.
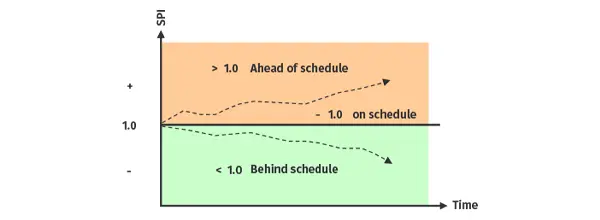
For example, an SPI of 0.85 indicates that the project is progressing at 85% of the planned rate. This is a clear signal to investigate what caused the schedule bottleneck.
A consistently low SPI usually points to a planning problem, a resource bottleneck, or work that is taking longer than expected. When progress data is compared directly with the baseline schedule, teams can see earlier where the delay starts. Cleopatra Enterprise’s Project controls software helps teams review progress data against the baseline in one place, making it easier to see where delays start and what needs attention first.
What is the Cost Performance Index (CPI)?
The Cost Performance Index (CPI) shows how cost-effective a project is. It compares the value of completed work to the actual costs incurred in doing that work.
Here is the formula to calculate CPI:
CPI = EV / AC
Where:
- EV (Earned Value) = Value of work performed.
- AC (Actual Cost) = Actual cost incurred for that work.
Interpretation:
- CPI = 1.0. The project is exactly on budget.
- CPI > 1.0. The project is under budget (cost-efficient).
- CPI < 1.0. The project is over budget (cost-inefficient).

For example, a CPI of 0.92 means that for every $1 spent, only $0.92 of value has been earned. This suggests that spending efficiency needs to improve. Cleopatra Enterprise helps teams review those cost trends earlier, so problems become visible before the overrun grows.
What is the Difference Between CPI and SPI?
The difference is straightforward: CPI shows how efficiently money is being spent, while SPI shows whether work is progressing at the planned pace. To better understand the differences and applications of SPI and CPI, refer to the comparison table below:
| Criteria | Cost Performance Index (CPI) | Schedule Performance Index (SPI) |
|---|---|---|
| Formula | CPI= Earned Value (EV) / Actual Cost (AC) | SPI= Earned Value (EV) / Planned Value (PV) |
| Purpose | Measures the cost efficiency of project work | Measures the schedule efficiency of project work |
| Interpretation | CPI>1: Under budget CPI=1: Over budget CPI<1: Over budget |
SPI>1: Ahead of schedule SPI=1: On schedule SPI<1: Behind schedule |
| Usage and application | Used for cost control, forecasting, and identifying areas of overspending or savings | Used for schedule tracking, progress forecasting, and identifying potential delays |
| Relation to Earned Value (EV) | Compares EV to the actual cost incurred to evaluate financial efficiency | Compares EV to the planned value to evaluate schedule efficiency |
Table 1. Cost Performance Index vs Schedule Performance Index
CPI and SPI are most useful when reviewed together. A project can look acceptable on cost while already slipping on schedule or appear on track in the schedule while cost pressure is building. Looking at both gives a more realistic view of performance.
Interpreting CPI and SPI in Project Management
In large CAPEX projects and tight turnaround schedules, even small shifts in CPI or SPI can grow quickly. That is why teams watch these metrics closely: they often show pressure before the full impact is visible in the cost report or schedule update.
One reporting period on its own says very little. What matters is whether CPI or SPI keeps moving in the wrong direction over several updates. For example:
- A declining CPI might suggest increasing costs due to poor scope control or unforeseen risks.
- A declining SPI could mean the project is lagging because of resource shortages or delays in the schedule.
CPI and SPI should never be read in isolation. Higher spending does not always mean a project is in trouble; it may also reflect faster progress or changes in scope. That is why teams should also look at planning quality, change orders, risk, and field productivity before drawing conclusions.
Understanding SPI and CPI Thresholds
Thresholds help teams decide when a deviation is still acceptable and when it needs action.
- If SPI and CPI are greater than 1: The project is performing efficiently. Work is progressing faster and/or at a lower cost than planned.
- If SPI and CPI are less than 1: The project is underperforming; it is falling behind schedule or going over budget. Immediate corrective action may be necessary.
- If CPI is higher than 1 an SPI is lower than 1: The project is under budget but behind schedule. This means that while cost efficiency is good, the pace of progress is slower than expected. In such cases, teams may be saving costs by using fewer resources or working cautiously. However, this can delay delivery. Thus, you should assess whether the slower progress will affect critical milestones or contractual deadlines.
- If CPI is lower than 1 and SPI is higher than 1: The project is over budget but ahead of schedule. In other words, work is progressing faster than planned, but the project has cost overruns. These could be due to overtime, resource inefficiency, or expedited procurement. While being ahead of schedule may seem positive, cost overruns can erode profitability or strain the project’s financial health. A balance between speed and cost control is needed.
Many organizations use thresholds like 0.9 or 1.1 as early warning limits. A CPI or SPI outside this range typically triggers management attention and leads to root cause analysis.
Thresholds should match the type of project. In large capital projects and turnarounds, even small deviations can affect later work. Cleopatra Enterprise supports this by helping teams review cost and schedule data together instead of in separate reports.
Using SPI and CPI to Improve Project Performance

Tracking CPI and SPI is only useful if the numbers lead to action. Their value comes from helping teams respond earlier and make better decisions. Here are several strategies experienced project managers use:
- Review CPI and SPI often enough to catch movement early, not only at month-end: Automate data collection for EV, AC, and PV with digital tools or EVM software, as manual reporting delays often hide early warning signals.
- If CPI drops, check what changed first: labor hours, material costs, scope, or productivity: If CPI drops below 1, analyze cost drivers such as labor, materials, or scope changes. If SPI falls, review resource allocation or task dependencies.
- Use current trends to test whether the final cost or finish date is still realistic: Use current CPI and SPI values to calculate Estimate at Completion (EAC) and predict final cost or schedule performance.
- Cost and schedule should be reviewed together: Avoid managing budgets and timelines in silos. Instead, platforms like Cleopatra Enterprise integrate cost, schedule, scope, and risk data, providing teams with a complete view.
- Share trends early, especially when the project still has time to respond: Share CPI and SPI trends with stakeholders. Transparency leads to proactive problem-solving instead of fixing afterwards when it’s often too late.
- Compare current performance with earlier similar projects: Leverage past CPI and SPI performance to refine future project estimates and improve forecasting accuracy.
Expert tip: In turnaround and capital-intensive industries, even a small improvement in CPI or SPI can lead to millions in savings. Regular variance reviews and automated dashboards make this achievable. Furthermore, if you take corrective actions, whether you add more scope or increase the budget, please note that this will most likely influence other factors as well. This interdependence is well explained by the Triple Constraint Theory, which emphasizes the balance between scope, time, and cost.
CPI and SPI only become useful when teams act on them. When cost, progress, and planning data are reviewed together, problems can be spotted earlier, and decisions can be made with more confidence. By monitoring CPI and SPI you enable yourself to analyze project success, improving predictability, and maximizing value throughout the project lifecycle.
Project cost management is one of the core disciplines in delivering capital projects on time and within budget.…
Operational efficiency in project management is about achieving more with less: delivering projects on time and within budget…
Related resources

Project Cost Tracking: A Practical Guide
Effective project cost tracking is essential to staying on budget and making informed decisions. This guide explains how to track costs step-by-step, avoid overruns, and use tools like CPI and EAC to forecast and control spending throughout the project lifecycle.
Read blog article
An Earned Value Management (EVM) Guide
Scope creep, budget constraints, and aligning actual work with planned tasks are just a few of the challenges faced by project managers. Ever wondered how amid these obstacles project managers keep track of progress effectively? Earned Value Management (EVM) is their not-so-secret weapon. Understanding EVM's significance is crucial; it not…
Scope creep, budget constraints, and aligning actual work with planned tasks are just a few of the challenges…
Read blog article