
Cost control Key Performance Indicators (KPIs) are important metrics that help project managers monitor, evaluate, and improve the financial performance of a project. These indicators help spot potential overspending, enhance resource use, and guide decision-making.
Understanding Project Cost Control
Project cost control involves tracking project spending against the approved budget to avoid cost overruns and meet financial goals. This process also includes forecasting, variance analysis, and change management. Effective cost control needs accurate data, prompt reporting, and a clear method to anticipate risks before they escalate.
A recommendation is to apply structured cost control from day one. Integrating cost control with scheduling, resource planning, and risk management provides a unified view of project performance and supports better decision-making.
The importance of using KPIs in Project Cost Control
Monitoring KPIs provides actionable insights that support proactive decision-making in cost control. They offer many benefits including:
1. Creating visibility into project performance:
Tracking KPIs provides real-time visibility into project performance. This transparency enables project managers to identify deviations before they escalate.
2. Supporting proactive decision-making:
KPIs enable early detection of potential cost overruns or schedule delays. By analyzing trends, managers can implement corrective actions, such as reallocating resources or negotiating with suppliers to prevent costly surprises.
3. Driving accountability and continuous improvement:
Lastly, using KPIs creates a culture of accountability among project teams. When stakeholders know that cost and schedule performance are continuously monitored, they are more likely to adhere to budgets, follow approved processes, and optimize productivity.
Expert tip: Projects without structured KPI monitoring often face delayed interventions, which can lead to disputes, rework, and unnecessary cost escalation. Therefore, establish a consistent KPI framework early on to ensure efficiency and strategic alignment throughout the project lifecycle.
Examples of KPIs for Project Cost Control
Several KPIs provide insights into budget performance, cost efficiency, and expected returns. Here are some of the most widely used KPIs in project cost control:
Cost Variance (CV)
Cost Variance (CV) is a key KPI for cost control. It measures the difference between the budgeted cost of work completed and the actual cost incurred:
CV = Earned Value (EV) − Actual Cost (AC)
Interpretation:
- A positive CV indicates the project is under budget.
- A negative CV signals the project is over budget. Thus, corrective action might be necessary.
Regularly monitoring CV gives project teams early visibility into cost deviations so they can take timely corrective actions. This proactive approach helps maintain budget discipline and reduces the risk of unexpected overruns.
Tip: integrate CV with Schedule Variance (SV) to get a complete picture of project efficiency.
Schedule Variance (SV)
While cost is critical, timing directly influences cost efficiency. Schedule Variance (SV) measures whether the project is ahead or behind schedule by comparing the work actually performed to the planned schedule:
SV = Earned Value (EV) − Planned Value (PV)
Interpretation:
- A positive SV indicates the project is ahead of schedule
- A negative SV shows the project is behind schedule, which often increases costs due to overtime, expedited materials, or extended resource usage.
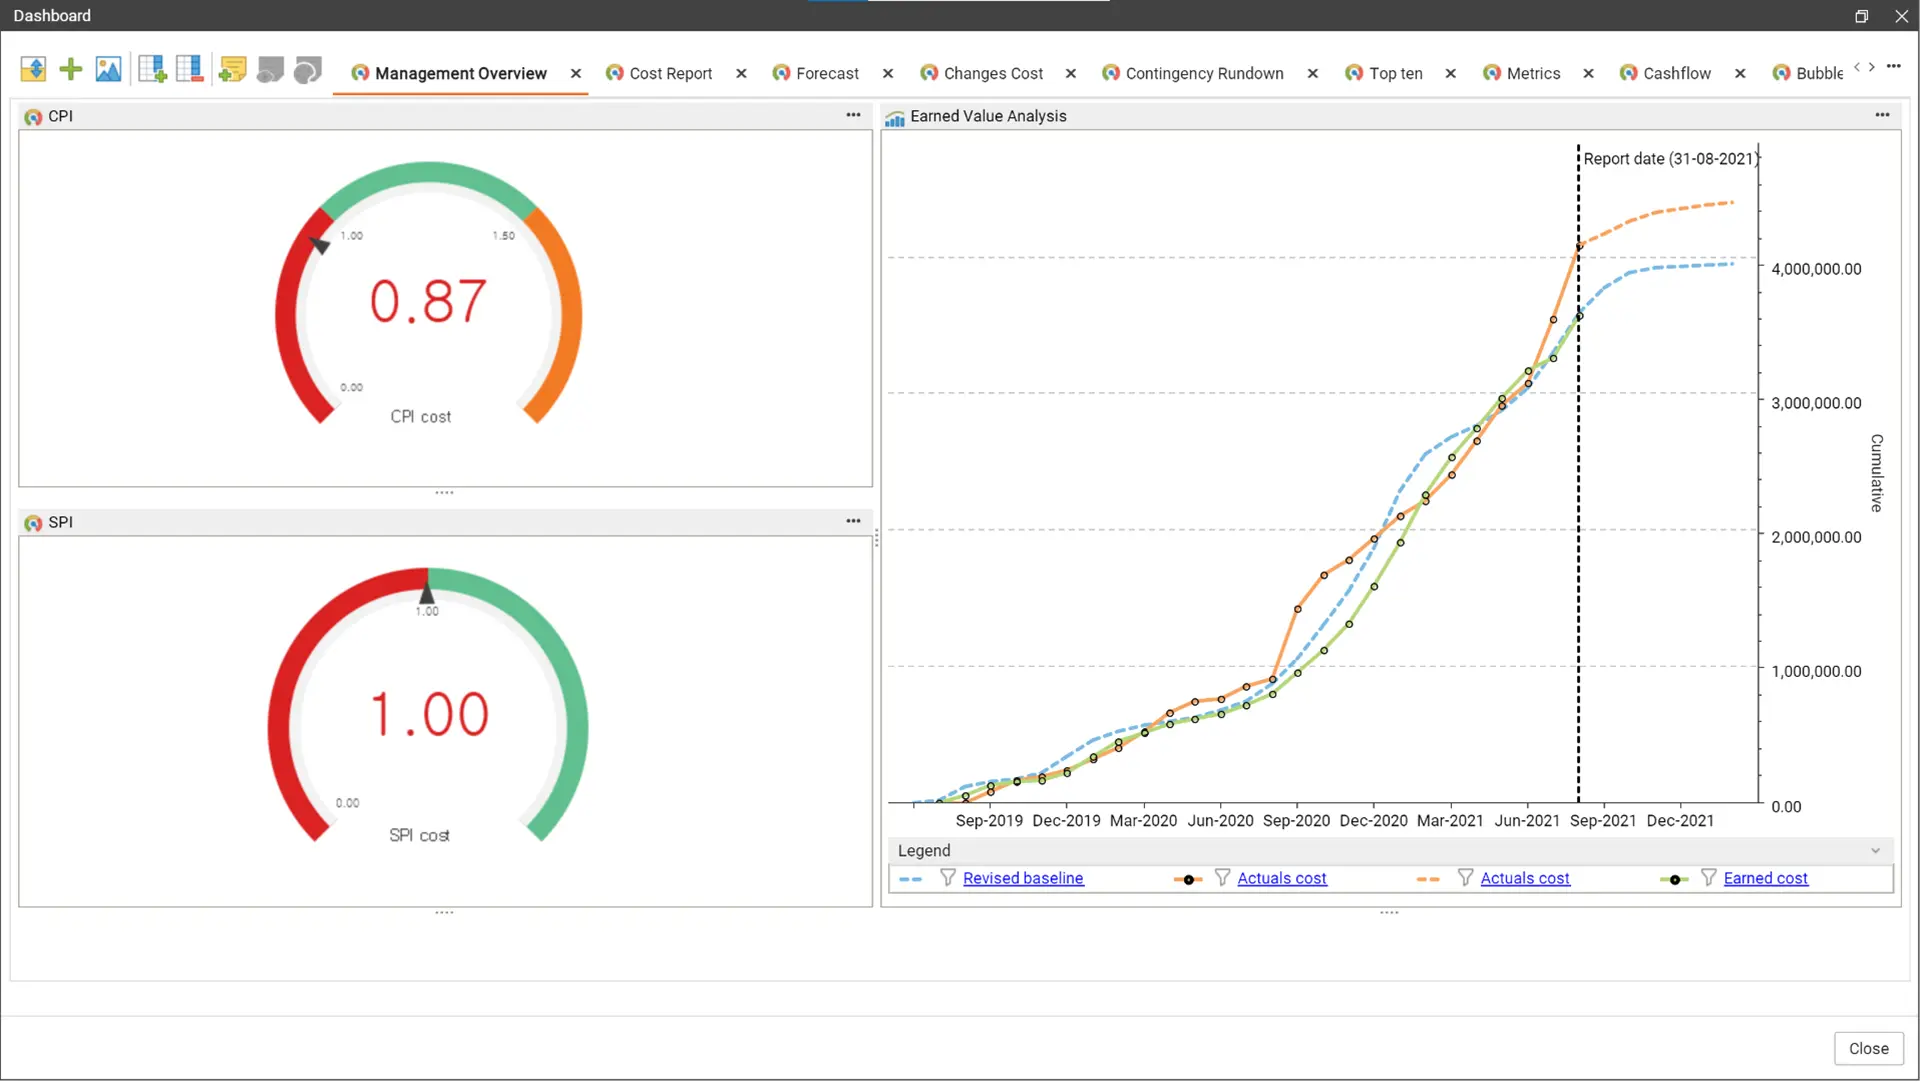
Cost Performance Index (CPI)
The Cost Performance Index (CPI) measures the cost efficiency of the work accomplished:
CPI = Earned Value (EV) ÷ Actual Cost (AC)
Interpretation:
- CPI > 1: The project is under budget.
- CPI < 1: The project is over budget.
For example, a CPI of 0.9 indicates that for every dollar spent, only $0.9 of value has been earned. This suggests that the project is over budget.

Using CPI is particularly valuable during project execution phases, where frequent cost reporting is required to track budget performance. For instance, in complex EPC projects, where small deviations can quickly escalate, CPI is an early warning metric that highlights cost inefficiencies before they impact the overall budget.
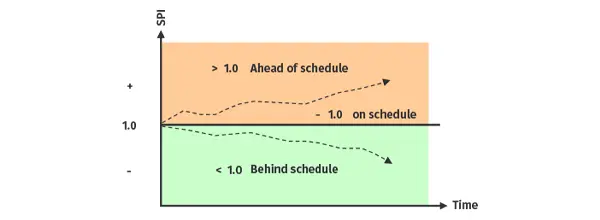
Schedule Performance Index (SPI)
While CPI focuses on cost efficiency, the Schedule Performance Index (SPI) evaluates how efficiently project teams are adhering to the planned schedule:
SPI = Earned Value (EV) ÷ Planned Value (PV)
Interpretation:
- SPI > 1: The project is ahead of schedule.
- SPI < 1: The project is behind schedule.
For example, an SPI of 0.75 indicates that for every planned hour of work, only 0.75 hours’ worth of work has been completed. This means that the project is progressing slower than planned.
SPI is especially useful during project execution to monitor schedule performance and identify potential delays before they impact critical milestones.
Budget at Completion (BAC)
Another KPI used by project controllers is Budget at Completion (BAC), which represents the total approved budget for the project:
BAC = Total Planned Cost of the Project
You can use BAC as a benchmark to compare ongoing expenditures and forecast final costs.
For instance, if a project’s BAC is $50 million and current expenditures already exceed planned progress, managers can forecast potential overruns and adjust resource allocation or scope to maintain control.
BAC is most valuable during project planning and baseline establishment, as it defines the cost target against which all performance is measured. Furthermore, you can use it when updating forecasts or negotiating scope changes to ensure that cost expectations remain transparent across stakeholders.
Estimate at Completion (EAC)
Once you have established the current CPI and BAC, the next step is to forecast the project’s expected final cost. That’s where the Estimate at Completion (EAC), which forecasts the total cost of the project based on current performance comes in:
EAC =AC + (BAC − EV) ÷ CPI
where:
- AC= actual costs
- BAC= budget at completion
- EV= earned value
- CPI=EV/AC
Calculating EAC offers a forward-looking view of project costs, which enables informed decision-making. For instance, it can come in handy when deciding about corrective actions, resource allocation, or contingency budget utilization.
EAC is especially useful in projects experiencing cost or schedule deviations as it provides a dynamic projection of total spending if current trends continue. Moreover, regularly using EAC helps stakeholders understand the financial implications of performance issues and supports more accurate forecasting for future phases.
Best practices when implementing Cost Control KPIs
Tracking KPIs like CV, CPI, SPI, EAC, and BAC is just the first step. The real value comes from using these metrics to make informed decisions and improve project outcomes.
- Track cost control KPIs consistently: Automate the calculation of CV, SV, CPI, SPI, EAC, and other metrics with digital tools or project controls software.
- Integrate cost and schedule data: Instead of managing budgets and timelines separately, combine cost, schedule, scope, and risk data to get a holistic project view.
- Analyze variances immediately: When CV or CPI signals a problem, investigate cost drivers like labor, materials, or changes in scope. For SV, look into scheduling dependencies and resource allocation.
- Forecast future performance: Use metrics like CPI, SV, and EAC to predict final costs and completion dates. This helps teams adjust plans proactively.
- Leverage historical performance: Compare current KPIs with past projects to refine estimates, improve forecasting accuracy, and guide future planning decisions.
Well-chosen cost control KPIs turn data into direction. When tracked consistently, they help project teams spot issues early, make confident decisions, and keep projects within budget.
What is Project Cost Management? Project cost management focuses on finding the right project and carrying it out…
In project management, performance measurement is key to delivering projects on time and within budget. Two critical indicators…
Related resources
Project Cost Tracking: A Practical Guide
Effective project cost tracking is essential to staying on budget and making informed decisions. This guide explains how to track costs step-by-step, avoid overruns, and use tools like CPI and EAC to forecast and control spending throughout the project lifecycle.
Read blog article
An Earned Value Management (EVM) Guide
Scope creep, budget constraints, and aligning actual work with planned tasks are just a few of the challenges faced by project managers. Ever wondered how amid these obstacles project managers keep track of progress effectively? Earned Value Management (EVM) is their not-so-secret weapon. Understanding EVM's significance is crucial; it not…
Scope creep, budget constraints, and aligning actual work with planned tasks are just a few of the challenges…
Read blog article